|
|




 |  |  |  |
This is our fourth full year of general insurance (GI) value measures data, covering January to December 2025. We publish this data each year to improve market transparency and give firms, consumer groups and other stakeholders a common set of indicators across a range of general insurance products. These indicators include claims frequency, claims acceptance rates, average claims payout, claims complaints rates and the proportion of premiums paid out in claims. |
This publication is a factual summary only. We explain any data challenges and limitations, and our approach to data quality below. Please note that our post-implementation review of the value measures rules is ongoing - we plan to publish our findings later this year, which will enable us to draw attention to the known data issues we are tackling (for example, the inconsistencies in how firms report claims acceptance data for home insurance).
This data supports our wider work, including:
Our ongoing commitment to the recommendations in our July 2025 retail insurance publication. In that work, we examined the reasons for increases in motor insurance premiums, with a focus on claims costs, and looked at claims handling in home and travel insurance.
Our expanded work to improve standards in the home and travel insurance markets following Which?’s super complaint. These issues remain priorities for us and feature in our Regulatory Priorities: Insurance report, published earlier this year.
How data informs our prioritisation and supervisory approach
We use the value measures data to identify areas where consumers may not be receiving fair value or good outcomes. This informs our assessment and prioritisation of market-wide issues or individual firms that need further investigation.
Our strategy makes clear that firms demonstrating that they are trying to do the right thing should expect lower-intensity supervision. On the other hand, firms with significant, multiple or recurring outlier indicators in the value measures data (as well as from other sources) should expect greater supervisory focus and action, especially where concerns persist or improvements are not being made.
As an example, the value measures data informed our previous action on GAP insurance from which firms agreed to pause selling until they could show that their products provide fair value to customers. The data was also used to form part of our response to the Which? super complaint. In our 2023 value measures publication, we set out actions for firms and our expectations under PROD4 and the Consumer Duty, which remain unchanged.
What the 2025 data showsHome and travel insurance
The data for home and travel insurance continues to reflect the trends we focused on in our response to the Which? super complaint and our Regulatory Priorities: Insurance report. We expect to see these measures improve through firms’ actions in response to our ongoing work. In particular:
Across both home and travel insurance, claims complaints as a percentage of claims registered are high compared with other retail insurance products - home insurance (7-13%) and travel insurance (5-6%), whereas most other products fall between (0-6%).
In home insurance:
Claims acceptance rates are relatively low - 62-71% for home compared with 83-86% for travel and 99% for motor. However, as noted in previous publications, we believe there are inconsistencies in how firms report claims acceptance data for home insurance and this means the rates should be used with caution. We have set up an industry working group to further consider value measures issues, including reporting inconsistency.
Average claims payout increased across home insurance products, especially buildings and contents, where it rose by 17%. Claims costs as a proportion of premiums remained stable at 48% for home insurance, combining buildings and contents (46% in 2024). In travel insurance:
Claims costs as a proportion of premium increased across all 3 travel products (annual European, annual Worldwide and single-trip stand-alone) from 2024 to 2025 (44-48% in 2025 vs 31-37% in 2024). Premiums increased by 12% for these products but the amount paid out in claims increased by 47%.
Claims costs across all products
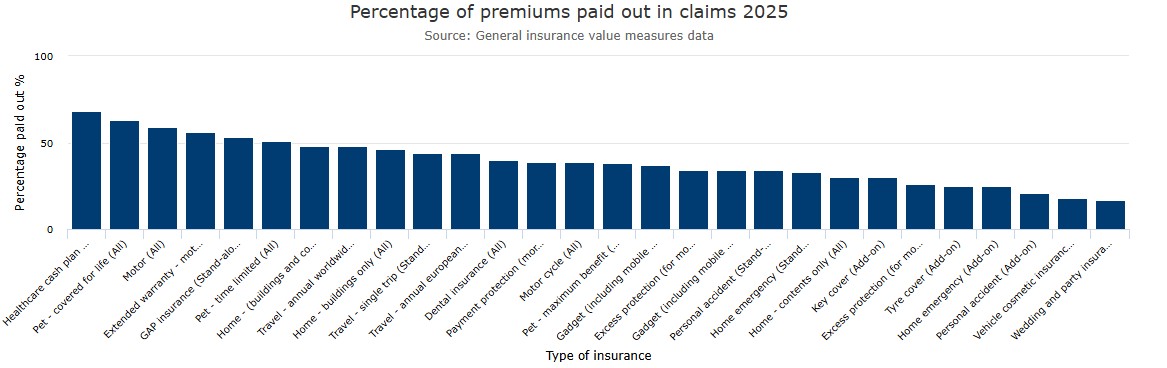
At aggregate product level, where at least 5 firms reported data and the data met our publication standards, we continue to see significant variation in claims costs as a proportion of premium, ranging from 17% for wedding and party insurance to 68% for healthcare cash plan (All). This is similar to the range in 2024, when the lowest was 20% for tyre cover (Add-on) insurance and the highest 69% for healthcare cash plan (All).*
* Range excludes data for GAP insurance.
 Other metrics of note
For Motor insurance, the largest retail general insurance product, premiums fell in 2025 by 7% while the average number of policies in force rose by 4%. A small increase in claims costs pushed claims costs as a proportion of premium from 54% in 2024 to 59% in 2025. For motor insurance (although it is also true of other products), there may be a time lag between the new business price captured in our data and the point when the claims payout is recorded. Where prices or claims costs are moving rapidly this can influence our data – particularly our figures on claims costs as a proportion of premium.
Data for GAP insurance continues to reflect the impact of our interventions in late 2023 and early 2024 with GAP insurance firms. In 2024, written premiums fell significantly and, while claims were still being paid, the claims costs as a proportion of premium rose above 100%. In 2025, claims costs as a proportion of premium for GAP (Stand-alone) insurance fell from 104% to 53%. Prior to our interventions, the proportion of premium paid out in claims for 2022 was 7% and for 2023 was 22%. We expected these figures to change dramatically between 2024 and 2025 as a result of our interventions. These figures should still be used with caution and may not yet be representative of product value or performance. Gadget insurance saw a fall in the percentage of premiums paid in claims, from 42% to 36% - one of the largest drops across all products. This was mainly driven by higher premium rates. Policies in force fell by 5% to 7.5 million, the number of claims registered fell by 8%, and claims costs fell by 12%, while premiums rose by 3%. Travel insurance policies in force for single-trip travel insurance, stand-alone single-trip policies rose by 15% to 3.1 million in 2025 – however, these figures should be used with caution. This figure is more volatile than for many other products given the short duration of these policies and the way that firms account for these policies in their data. Travel policies provided under packaged bank accounts are not included in our value measures data. Factors to consider when analysing the data
A wide range of factors can affect the value of a general insurance product. These factors should be considered together, rather than looking at individual measures in isolation. Some factors that are not visible in the value measures data may also affect the results for a given period. These include business mix, product age, policy duration, target market and business volumes. External factors such as climate, inflation and wider societal issues may also have an impact.
The proportion of premiums paid out in claims is one possible indicator of the relationship between the price of risk and the total price. It may vary over time or between firms, for example because of a new product launch, a fall or pause in sales, or significant pricing changes. We publish this metric at aggregate product level because it allows some comparison across products, where other measures may be more affected by product-specific features.
The data is not intended to help consumers choose insurance products directly. It is historical and may not reflect products and prices available today. Consumers with questions about the value of their insurance products should speak to their insurer or broker. It is important that consumers understand the cover they are buying, have confidence that it offers fair value, and are treated fairly when making a claim.
Data quality
Firms are responsible for submitting complete and accurate Value Measures data by 28 February each year. Before publication, we validate the data to identify and clarify anomalies that may materially affect aggregate product data, and to ensure firms correct and resubmit returns where errors are confirmed. This year, we contacted 35 firms as part of this process, around half of which resubmitted data. Reporting inaccuracies or inconsistencies may still remain between firms, but we seek to resolve the most material issues through this process.
Our reporting system is live and can accept resubmissions at any time. Once validation is complete, we therefore take a fixed snapshot of the data to preserve the version validated with firms and enable publication. This also prevents later submissions from introducing new anomalies or errors. The data published today reflects the data held in FCA systems on 5 May 2026.
This year, three firms updated their data after the fixed snapshot was taken. In most cases, these updates had minimal impact on aggregate product data. However, following late clarification from one firm that it had made a material reporting error, as an exception we decided to manually update two datapoints in the product aggregate data:
2024 claims acceptance rate for Before the event legal expenses – home (All)
2024 average claims payout for Home (buildings and contents combined) (All)
We judged that the firm’s error had a sufficiently material impact on the market-wide data for those datapoints to justify manual correction. We are not aware of any further material issues with the data and have retained the fixed snapshot elsewhere in the data. We are following up with firms where reporting needs to improve and considering broader options to strengthen data quality.
Data may also change between publication cycles if firms identify and correct errors outside the normal reporting period, for example through routine audit activity. Comparisons with previous publications should therefore be made with care.
What the data includes
The data includes firm-specific information on claims frequency, claims acceptance rates, average claims payouts and claims complaints as a proportion of claims for a wide range of retail GI products.
Firms must report on relevant products sold to consumers in the UK where total written retail premiums are above £400,000 in the reporting period and there are more than 3,000 policies in force during that period. As before, we are publishing data about individual firms where the same reporting threshold is met at detailed product level.
We have included additional context at aggregate product level to help readers interpret the data. For example, we have calculated the proportion of premiums paid out in claims. Our aggregate product data includes only products where 5 or more firms submitted data and where the data met our publication standards.
In Policy Statement PS20/9 we said that we would not require firms to report claims cost information for legal expenses insurance or vehicle breakdown insurance. The data does not include related metrics for these products.
|
|
|
|
| Pricing Actuary – Cyber | ||
| London - £120,000 Per Annum | ||
| Reinsurance Pricing Actuary, Analytics | ||
| London - £130,000 to £180,000 Per Annum | ||
| Actuary - Financial Planning & Analysis | ||
| London/Hybrid - Negotiable | ||
| Reinsurance Pricing Actuary | ||
| London - £140,000 Per Annum | ||
| Head of Capital | ||
| London - £170,000 Per Annum | ||
| ART Pricing | ||
| London - £100,000 Per Annum | ||
| Pricing Transformation Actuary | ||
| London - £130,000 Per Annum | ||
| Pricing Actuary | ||
| London - £80,000 to £120,000 Per Annum | ||
| Pensions on Divorce Startup - Flexibl... | ||
| Remote - Negotiable | ||
| SVP, Head of Reserve Forecast Analytics | ||
| Bermuda - £200,000 Per Annum | ||
| START-UP, Lead Reinsurance Actuary | ||
| London - Negotiable | ||
| Senior Actuary | ||
| London - Negotiable | ||
| Reserving Manager | ||
| London - £130,000 Per Annum | ||
| Senior Reserving Consultant | ||
| London - £100,000 Per Annum | ||
| Head of Capital | ||
| London - £180,000 Per Annum | ||
| Head of Portfolio Optimisation | ||
| London - Negotiable | ||
| Pricing Lead/Manager | ||
| London - £130,000 Per Annum | ||
| Actuary | ||
| London/Hybrid - Negotiable | ||
| Capital Actuary | ||
| London - £110,000 Per Annum | ||
| Senior Reserving Actuary | ||
| London - Negotiable | ||




Be the first to contribute to our definitive actuarial reference forum. Built by actuaries for actuaries.
Copyright © 2026 Actuarial Post. Created by Zero-One Design Ltd