By Alex White, FIA, C.Act, Managing Director, Co-Head of ALM at Redington
This happens even when successive data points are independent. To use a height-based analogy: an eight-foot parent’s children are likely be tall too, but the likelihood (based on the mean height of the general population) is the child will still be shorter than eight feet tall.
By contrast, ‘active reversion’ implies an underlying force ‘pulling’ data back to the mean. To illustrate this, imagine someone stumbling forwards in a valley. Once they start lurching to one side, then going further up the same side becomes harder and going back (down) toward the other side becomes easier.
Both ideas can be tested against the data. Let’s take the S&P500 as an example, backfilled with Yale economics professor Robert J. Shiller’s monthly US equity data from 1870 onwards.
Firstly, we can check autocorrelations. This is 3% for excess returns (2% for total returns, 0% for real) – so last year’s return is 3% correlated with this year’s. This means successive annual returns are effectively independent.
If annual returns are independent that suggests active mean reversion isn’t happening; however, it could still happen over a longer period. Crashes tend to be clustered, so one event could lead to two bad years, which could throw off the autocorrelation.
Another test is to compare annualised standard deviations. The idea for this is any active reversion should result in lower volatilities for long-term holding periods.
There are a few ways to tackle this, though the results are similar. We take the whole time series and use rolling annual data and look at the annualised volatilities through time. And we do see a decline.
So, do equities mean revert? Maybe.
We also asked, “what would it look like if there were no reversion?” and simulated 1,000 150-year time series. We took the volatilities of rolling n-year periods, on annual data, to see how this declined through time.
A small part of the decline is from the methodology, as we see in the simulations, but more than that, the results could just be luck. Even with the most extreme of the three-time series - and using a one-tailed test - we still fall some way short of significance. The data has a lot of noise.
There’s even meaningful variation (2.2%) in the annual volatility depending on which month you start from. That is, if you take the 150-year time series from June to June, or from August to August, the volatilities differ by over two percentage points.
But perhaps the clearest example is to add a time series which does show mean reversion, dividend yields. While not exactly like-for-like, the decline in volatility is much harder to argue against there.
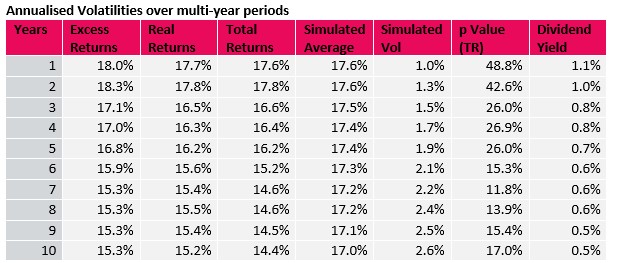
Source: Data– Yale/Robert J. Shiller, Bloomberg. Calculations – Redington, a Gallagher Company. Results shown are for excess returns, but similar for total returns (Date: up to June 2025)
So, there’s reason to believe that returns are independent, but not much evidence for active reversion. It might happen, but if it does it’s hard to argue it’s particularly strong. That means markets may be less likely than conventionally expected to bounce back after a fall.
Disclaimer:
For professional investors only. Not suitable for private customers.
The information herein was obtained from various sources. We do not guarantee every aspect of its accuracy. The information is for your private information. This is not advice and should not be relied upon to make any decisions. A variety of market factors and assumptions may affect this analysis, and this analysis does not reflect all possible loss scenarios. There is no certainty that the parameters and assumptions used in this analysis can be duplicated with actual trades. This document is based on information available to Redington Ltd at the date of publication and takes no account of subsequent developments after that data. Further, any historical exchange rates, interest rates or other reference rates or prices which appear above are not necessarily indicative of future exchange rates, interest rates, or other reference rates or prices. Neither the information, recommendations or opinions expressed herein constitutes an offer to buy or sell any securities, futures, options, or investment products on your behalf. Unless otherwise stated, any pricing information in this document is indicative only, is subject to change and is not an offer to transact. Where relevant, the price quoted is exclusive of tax and delivery costs. Any reference to the terms of executed transactions should be treated as preliminary and subject to further due diligence.
Redington Ltd are regulated by the Financial Conduct Authority. Redington Ltd do not advise on all implications of the transactions described herein. This information is for discussion purposes and prior to undertaking any trade, you should also discuss with your professional tax, accounting and / or other relevant advisers how such particular trade(s) affect you. All analysis (whether in respect of tax, accounting, law or of any other nature), should be treated as illustrative only and not relied upon as accurate.
©Redington Limited 2025. All rights reserved. No reproduction, copy, transmission or translation in whole or in part of this document may be made without permission. Application for permission should be made to Redington Limited at the following address – Floor 6, One Angel Court, London, EC2R 7HJ.
Redington Limited (06660006) is registered in England and Wales. Registered office: One Angel Court, London EC2R 7HJ
|