|
|


 UK with-profits funds maintain a significant home bias, with listed equity allocations far exceeding the UK's 3.5% weight in the FTSE All-World Index. This bias is costing policyholders returns. In this article, we explore: the impact this bias has had on past performance; why UK with-profits funds favour an overweight to UK equities; and future relative performance of UK vs global equities. |
By Chris Pritchard, Principal and Co-Head of Insurance Investment and Amit Lad, Principal, Insurance and Longevity Consulting at Barnett Waddingham In particular, we encourage with-profits funds (and other insurers) to consider whether any significant home bias within their equity portfolios remains appropriate, or whether they can benefit from increased returns without materially increasing capital requirements and meeting their other investment constraints. It’s important to recognise that the average UK with-profits fund is a balanced multi-asset fund, of which listed equities are only one component. Any impacts we talk about will be diluted for individual funds, reflecting that listed equities are just one part of a balanced asset allocation.
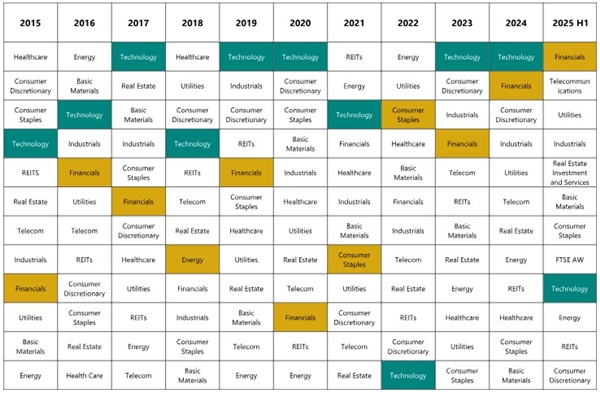
The performance cost Using the FTSE All-Share (UK equities) versus FTSE All-World ex UK (global equities) as benchmarks, UK equities have underperformed global markets in eight of the last ten years. Only 2022 and early 2025 showed relative outperformance. The culprit is sector composition. Global equity markets have been dominated by technology sector outperformance, particularly in the US. In contrast, the UK equity market remains heavily weighted toward sectors that have experienced slower growth such as financials, energy, and consumer staples. Figure one: sector returns ranking by year. Source: FTSE, LSEG Workspace
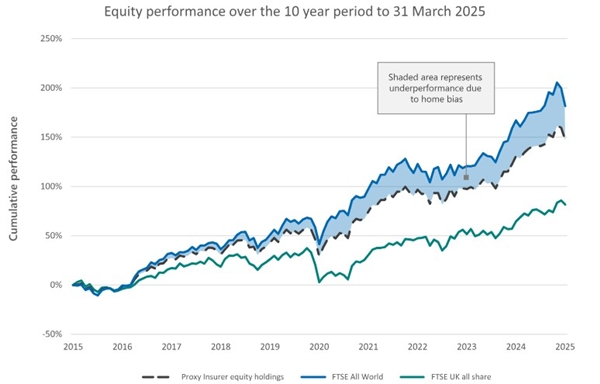
Sector highlighted in GREEN is the most underweight in UK relative to the global market cap in that year. Sector highlighted in YELLOW is the most overweight in UK relative to the global market cap in that year. The UK equity market maintains a significant underweight exposure to the technology sector - an area that has delivered exceptional returns over the past decade, consistently outperforming sectors where the UK is overweight, such as financials, energy, and consumer staples. Although the first half of 2025 has seen a modest shift - driven in part by the relative resilience of UK-dominated sectors amid global uncertainty following Donald Trump’s election victory and the introduction of new tariffs - the broader trend remains one of persistent underperformance. This reflects fundamental structural differences in sector composition between UK and global equity markets. The cumulative impact is substantial. Over the past decade, this home bias has created meaningful performance drag compared to global market cap weightings. Figure two: performance drag for the average UK with-profits fund compared to investing in-line with global market cap over a ten-year period. Source: FTSE, LSEG Workspace
The performance gap in earlier periods will not have been as extreme given the UK equity market generally kept up with the wider market during the 1980 and 90s, representing the period in which large volumes of UK with-profit product were sold.
Why the bias persists Our discussions with with-profits committees and investment committees from the participants in our annual with-profits survey reveal three main themes for persistent bias:
Theme one: use of risk budgets and capital
Whilst there is scope to increase expected return, funds often have limited risk budgets and capital to support the increased volatility and capital requirements. Some funds are also mindful of some of the less quantifiable benefits of trading in the familiar UK market – for example, during periods of market stress, some with-profits funds noted benefits from the operational simplicity and potential liquidity advantages of working in a domestic market, where they have established relationships and potentially a deeper market knowledge.
Theme two: Operational inertia and risk management culture
Many funds are aware of the reputational risks associated with making significant allocation changes that subsequently underperform. A fund implementing a decision to follow the global cap in early 2025 would be drastically underperforming for the current calendar year. Many funds are also cautious of being the ‘first material mover’ and appear out of line with peer funds. However, despite these blockers, we have seen funds appear to be moving towards reducing the UK bias, albeit slowly.
Theme three: Policyholder expectations and prior communications
Some funds have set a long history of expectations for policyholders as to where their policies are invested, and changing this is not a quick and trivial exercise.
Recent government initiatives encouraging institutional investment in domestic assets may slow funds’ departure from this bias in the near future.
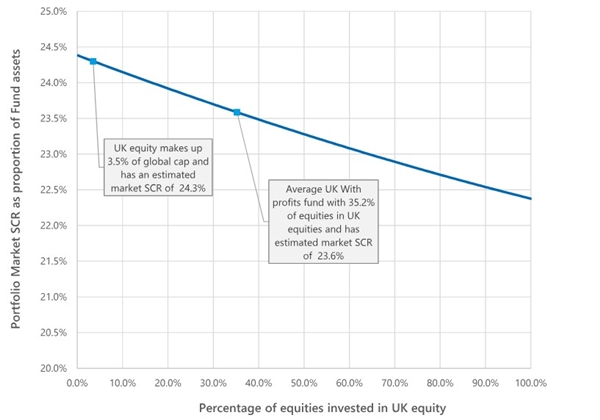
The capital analysis The modest impact is due to listed equities being just one component of a balanced portfolio, and most listed global equities attracting the same type one capital charge as listed UK equities. The increase in capital can be partially mitigated by currency hedging global equity investments as shown in the chart below. Figure three - chart showing the standard formula market SCR for an average UK with-profits fund, with the listed equity allocation varying between UK and global equities.
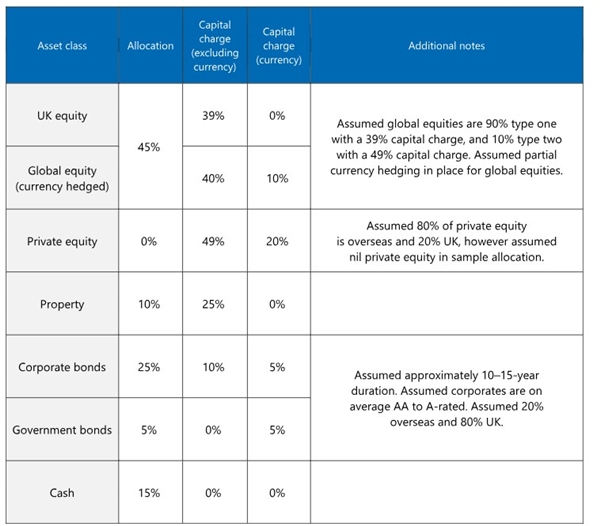
To estimate this, we have assumed that the fund is using the standard formula. The standard formula assumptions are set out in the next table.
In addition, we have not considered any liability offsets or management actions, we have assumed the symmetric adjustment is nil, and a well-diversified portfolio is held such that there is nil concentration risk.
Looking forward Employing a global market capitalisation weighted index offers the broadest range of investment opportunities for investors, adequately diversifying risk amongst sectors. Limiting exposure based on geographical borders can unintentionally concentrate portfolios in sectors with slower prospects. Whilst sectors like financials, industrials and other consumer staples play an important role in the wider economy, they generally lack the characteristics needed to drive long-term growth. Therefore, in our opinion, shifting away from a bias towards UK equities will be beneficial for all equity investors.
Our recommendation |
|
|
|
| Actuary - Financial Planning & Analysis | ||
| London/Hybrid - Negotiable | ||
| Reinsurance Pricing Actuary | ||
| London - £140,000 Per Annum | ||
| Head of Capital | ||
| London - £170,000 Per Annum | ||
| ART Pricing | ||
| London - £100,000 Per Annum | ||
| Pricing Transformation Actuary | ||
| London - £130,000 Per Annum | ||
| Pricing Actuary | ||
| London - £80,000 to £120,000 Per Annum | ||
| Pensions on Divorce Startup - Flexibl... | ||
| Remote - Negotiable | ||
| SVP, Head of Reserve Forecast Analytics | ||
| Bermuda - £200,000 Per Annum | ||
| START-UP, Lead Reinsurance Actuary | ||
| London - Negotiable | ||
| Senior Actuary | ||
| London - Negotiable | ||
| Reserving Manager | ||
| London - £130,000 Per Annum | ||
| Senior Reserving Consultant | ||
| London - £100,000 Per Annum | ||
| Head of Capital | ||
| London - £180,000 Per Annum | ||
| Head of Portfolio Optimisation | ||
| London - Negotiable | ||
| Pricing Lead/Manager | ||
| London - £130,000 Per Annum | ||
| Actuary | ||
| London/Hybrid - Negotiable | ||
| Capital Actuary | ||
| London - £110,000 Per Annum | ||
| Senior Reserving Actuary | ||
| London - Negotiable | ||
| Head of Capital | ||
| London/Hybrid - Negotiable | ||
| Head of Pricing | ||
| London - £170,000 Per Annum | ||


Be the first to contribute to our definitive actuarial reference forum. Built by actuaries for actuaries.
Copyright © 2026 Actuarial Post. Created by Zero-One Design Ltd