 |
 |
By S. J. Richards

Honorary Research Fellow - Heriot-Watt University
This article looks at selected issues in actuarial practice regarding mortality and longevity, and illustrates some of the points raised in the workstream “Mortality: drivers for change" during the inter-disciplinary conference which took place in Edinburgh in October 2009. The article introduces the main limitations and risks for actuaries in attempting to create mortality projections based on extrapolating trends by cause of death.
Examining past trends in cause of death can be informative. As a result, some actuaries have attempted to extrapolate trends in causes of death to create a forecast of future mortality rates. This has an initial appeal: using a more detailed breakdown of mortality data feels like it ought
to result in a better quality forecast. However, separate projections by cause of death need to be
recombined to produce all-cause rates. This is particularly tricky, since we are projecting correlated
time series | for example, smoking increases mortality due to both heart disease and numerous
cancers. A further complication is that the same projection model might not be suitable for all
causes of death, as different causes have different time-based linkages:
“Causes of deaths characterized by well-defined cohort effects, such as lung cancer need to be forecast using model[s] which incorporate cohort factors."
Di Cesare and Murphy (2009)
Trends by cause of death are not independent, and some causes of death may be linked in poorly
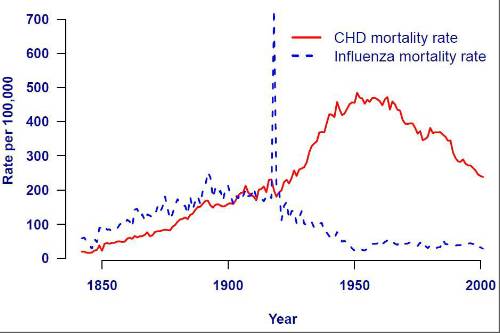
understood ways. For example, Azambuja and Levins (2007) postulated links between inuenza
and coronary heart disease, as suggested by the apparent correlation in Figure 1.

Figure 1. Mortality rates from influenza and coronary heart disease in Massachusetts. Styled after Azambuja and Levins (2007). Data from Massachusetts Department of Public Health \Registry of Vital Records and Statistics".
Even within a cause-of-death group, Azambuja (2009) points out that "the term CHD encompasses
more than one disease" and as a result that “CHD mortality trends represent a varying combination
of types of CHD over time". If the underlying composition of an important cause of death is
changing, this increases the uncertainty over the reliability of any projections of that cause of
death.
CMI (2004) gives a good overview of some of the technical problems with cause-of-death fore-
casts, concluding that it is preferable to use all-cause mortality data. In a review report the UK
Government Actuary's Department (2001) provides a more detailed review, leading to the same
conclusion.
Another stumbling block is that mortality rates by cause of death are strongly linked to socio-
economic group, which is an important risk factor in actuarial work. For example, Romeri, Baker
and Griffiths (2006) show the link between cause-of-death rates and deprivation index, and we
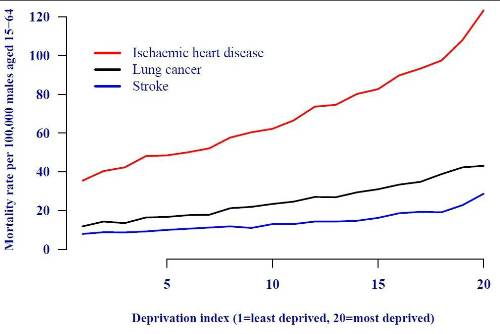
reproduce some of their data in Figure 2.
The implication of Figure 2 is that cause-of-death statistics need to be broken down by socio-
economic group or deprivation index before being used for forecasting purposes for actuarial work.
Failure to do this could give misleading results, since the various sections of society appear in
cause-of-death statistics in different proportions to their presence in the population.

Figure 2. Mortality rates by deprivation index for selected major causes of death. The lives who
account for the largest proportion of actuarial liabilities have a different cause-of-death mix than
the wider population. Source: ONS data for males aged 15-64 in England and Wales.

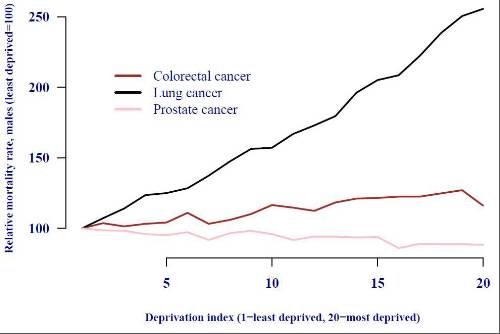
Figure 3. Relative mortality rates by deprivation index for selected major cancers. There is no
simple relationship between cause incidence and deprivation index: lung-cancer rates rise sharply
with deprivation, whereas prostate-cancer rates fall slightly. Projections based on extrapolating
rates by cause of death in the population may be misleading for annuity liabilities, which are
concentrated in the least-deprived sub-group. Source: ONS data for males of all ages in England
and Wales.
Figure 2 briefly raises the hope that differences by deprivation index might be similar across the
various causes of death, i.e. that the rates might be in some kind of constant proportion. However,
Figure 3 shows that this is not the case for the three most important cancers for males in England
and Wales. Figure 2 shows that separate handling of cause-of-death data by deprivation index or
socio-economic group is necessary, but Figure 3 shows that the relationship is not simple.
There is a corollary to this and it is linked to concentration risk, i.e. the tendency for the least
deprived members of society to have the biggest pensions and sums assured. Richards (2008) notes
that around half of all pensions in payment are paid to around 10% of the pensioner population,
while Figures 2 and 3 show that the least deprived members of society have both different mortality
rates and a different cause-of-death mix from the most deprived. Simply put, people with the largest
liabilities in a pensioner portfolio have a different cause-of-death mix than the wider population.
When projecting all-cause mortality rates it is common for people to ask what sort of changes in
causes of death might be required to achieve a particular scenario. Often one is asked to posit what
causes of death have to be “eliminated", and the results from such calculations might lead to the
mistaken conclusion that a particular projection is unlikely and therefore too prudent. However,
the linkages between causes are complex; indeed, reducing mortality due to one cause of death
can lead to an increase in mortality due to another. One example is prostate cancer, which was
historically considered rare but by 2008 had become the fifth most common cause of death amongst
males above age 85 in England and Wales (and the most common cancer cause of death, exceeding
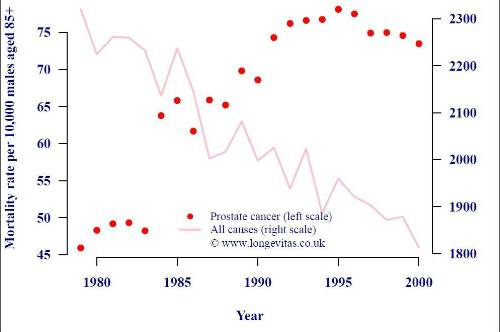
even lung cancer). Mortality rates for this age group are shown in Figure 4.

Figure 4. Mortality rates per 10,000 males over age 85 in England and Wales. Source: ONS data
in “20th Century Mortality", a CD containing cause-of-death data for England and Wales.
Figure 4 shows that although all-cause mortality rates in this age group have fallen steadily, the
mortality rate due to prostate cancer has clearly risen. Prostate cancer is slow-growing, and it is
often described as something a male is more likely to die with than from. As other causes of death
reduced, however, the likelihood of dying from this cause actually increased. Unless this sort of
linkage is allowed for, using cause-of-death \elimination" calculations make scenarios appear more
prudent than they are. Such calculations are sometimes used to communicate mortality projections,
but this example shows that this could lead to a false level of comfort.
A final observation on Figure 4 is that there is a clear discontinuity in prostate-cancer mortality
rates between 1983 and 1984, which is suggestive of a change in diagnosis and/or classification. This
serves to underline the uncertainty of the data on which cause-of-death projections are based. The
impact of shifting rules for cause-of-death classification are described by Aylin (1997) as follows:
“Trend analysis spanning the years either side of 1984 and 1993, must take into account some important coding changes. There is a large increase in mortality from chronic diseases [...] between 1984 and 1993. This is an artefact due to changes in the way ICD-9 rules for selecting the underlying cause of death were interpreted in England and Wales. [...] As a result, some deaths for which bronchopneumonia in Part I of the certificate would previously have been coded as the underlying cause of death were coded to a condition mentioned elsewhere in Part I or Part II."
Aylin (1997)
In other words, some of the “trends" by cause of death are a result of changes in classification
methodology. When doing projections by cause of death we must not only take great care with
socio-economic differentials, and also worry about projecting correlated time series, but we must
also take note of uncertainty surrounding the classification of cause of death itself.
The challenges for cause-of-death projections described in the preceding sections are compounded
by an issue of particular concern to actuaries: bias. Bias is generally undesirable in any forecasting
method when applied to financial calculations. However, it is particularly undesirable when
projecting future mortality rates for reserving for pension liabilities, especially if there is a bias towards over-stating mortality rates which would lead to under-reserving. Unfortunately, this kind of bias
appears to be a specific feature of cause-of-death projections:
“Mortality projections disaggregated by cause of death have been found in practice to be more pessimistic than those without disaggregation [...]. The reason is straightforward: over time the overall trend becomes dominated by the trend for those causes with the slowest decline."
Wong-Fupuy and Haberman (2004)
Cause-of-death methods are sometimes described as having the ability to incorporate expert medical
opinions. However, this is often not the advantage it appears to be:
“The advantage of expert opinion is the incorporation of demographic, epidemiological and other relevant know-edge, at least in a qualitative way. The disadvantage is its subjectivity and potential for bias. The conservativeness of expert opinion with respect to mortality decline is widespread, in that experts have generally been unwilling to envisage the long-term continuation of trends, often based on beliefs about limits to life expectancy."
Booth and Tickle (2008)
Booth and Tickle (2008) list several examples where expert opinion has under-estimated rates of
mortality improvement. In this section and the preceding ones we have seen a number of major technical, practical and fundamental difficulties with projecting mortality rates by cause of death. It is for these reasons that many actuaries prefer stochastic projection methods. The reader is directed to Booth and Tickle (2008) for a comprehensive overview of various projection methods.
Actuaries must take great care in using cause-of-death data as a basis for creating forecasts of
future trends. Mortality by cause is strongly linked to socio-economic status, which itself is a major
risk factor for mortality and longevity. Furthermore, cause-of-death data in England and Wales is
subject both to changes in classification system and also to classification guidelines within a cause
system. Finally, cause-of-death methods are vulnerable to systematic bias, leading towards over-
estimation of forecast mortality rates. This is of particular concern when creating reserving bases
for pension liabilities.
Acknowledgements
This article is adapted from a fuller-length paper, Richards (2009). Any errors or omissions remain
the sole responsibility of the author. Graphs were done in R (2004).
References
Aylin, P. (1997). Background note on Twentieth Century Mortality Files, Office for National Statistics.
Azambuja, M. I. and Levins, R. (2007). Coronary Heart Disease | One or several diseases?, Perspectives in
Biology and Medicine, Volume 50, Number 2 (spring 2007):228{42.
Azambuja, M. I. (2009). Connections between causes of diseases: Inuenza and Sutherland's \epidemiology of
constitutions", Presentation to Joining Forces on Mortality and Longevity, 22 October 2009, Edinburgh.
Booth, H. and Tickle, L. (2008). Mortality modelling and forecasting: a review of methods, Annals of Actuarial
Science, Vol. 3, Parts 1 and 2, page 8.
CMI (2004). Projecting future mortality: A discussion paper, Continuous Mortality Investigation Mortality sub-
committee Working Paper 3.
Di Cesare, M. and Murphy, M. (2009). Forecasting mortality, different approaches for different cause of deaths?
The cases of lung cancer; influenza, pneumonia, and bronchitis; and motor vehicle accidents, Presentation to Joining
Forces on Mortality and Longevity, 22 October 2009, Edinburgh.
Government Actuary's Department (2001). National Population Projections: Review of Methodology for
Projecting Mortality, Government Actuary's Department, NSQR No. 8, pages 18{21.
R Development Core Team (2004). R: a language and environment for statistical computing, R Foundation for
Statistical Computing, Vienna, Austria. ISBN 3-900051-07-0, URL http://www.r-project.org.
Richards, S. J. (2008). Applying survival models to pensioner mortality data, British Actuarial Journal 14, II,
257{326.
Richards, S. J. (2009). Selected Issues in Modelling Mortality by Cause and in Small Populations, British
Actuarial Journal 15, supplement, 267{283.
Romeri, E., Baker, A. and Griffiths, C. (2006). Mortality by deprivation and cause of death in England and
Wales, 1999-2003, Health Statistics Quarterly 32, National Statistics.
Wong-Fupuy, C. and Haberman, S. (2004). Projecting mortality trends: recent developments in the United
|
|
|
|
| Take the lead client-facing projects ... | ||
| Various locations - Negotiable | ||
| Choose Life! Choose a major global co... | ||
| Various locations - Negotiable | ||
| Actuarial skillset? Apply now for Snr... | ||
| South East / hybrid with travel requirements - Negotiable | ||
| Financial Risk Leader - ALM Oversight | ||
| Flex / hybrid - Negotiable | ||
| Be the very model of a modern Capital... | ||
| London - Negotiable | ||
| Pensions Actuary seeking a high-impac... | ||
| London or Scotland / hybrid 3dpw office-based - Negotiable | ||
| Great opportunity for Pensions Actuar... | ||
| London or Scotland / hybrid 3dpw office-based - Negotiable | ||
| Responsible Investing Manager - Clima... | ||
| London/Hybrid - Negotiable | ||
| Quant Strategist | ||
| London/Hybrid - Negotiable | ||
| Multiple remote longevity contracts | ||
| Fully remote - Negotiable | ||
| Multiple remote inflation hedging con... | ||
| Fully remote - Negotiable | ||
| Play a vital role in shaping a new He... | ||
| London or Scotland / hybrid 50/50 - Negotiable | ||
| Support the Longevity team of a globa... | ||
| London / hybrid 2 days p/w office-based - Negotiable | ||
| Delve into financial risk within a ma... | ||
| Wales / South West / hybrid 1dpw office-based - Negotiable | ||
| Project-based Life Pricing Actuarial ... | ||
| South West / hybrid 2 dpw office-based - Negotiable | ||
| Pricing Actuary | ||
| London - £120,000 Per Annum | ||
| Develop your career in motor pricing | ||
| UK-wide / hybrid 2 dpm office-based - Negotiable | ||
| Experience real career growth in home... | ||
| UK-wide / hybrid 2 dpm office-based - Negotiable | ||
| Be at the cutting edge of technical p... | ||
| UK-wide / hybrid 2 dpm office-based - Negotiable | ||
| Use your passion for innovation and t... | ||
| London / hybrid 2 days p/w office-based - Negotiable | ||
Be the first to contribute to our definitive actuarial reference forum. Built by actuaries for actuaries.