By Alex White, Head of ALM Research, Redington
They may still be proved right in the end, but it’s been an expensive decade for anyone investing with that view. This begs the question of how well the broader argument works- that is, does it make sense to say that the present is in some sense “extreme”? If you judged whether rates were historically low, based on history, could you have predicted the direction of future moves?
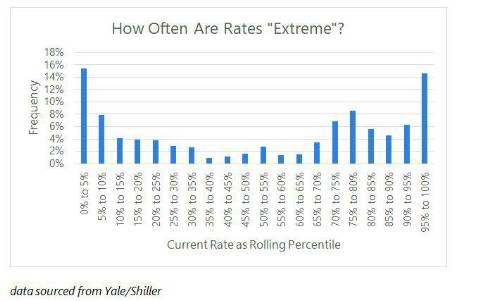
To explore this, we looked at how ex-ante rate levels would have been viewed when judged against the history up to that point. We took Shiller data on long US rates since 1870, and allowed 20 years to build a set of levels for comparison, so we only judge percentile levels when there is at least 20 years’ history to compare it against. The choice of 20 years is arbitrary, but does not make much difference. On this basis, we can regard rates as extreme if they are in either 5% tail- i.e. if they’re higher or lower than they had been for 95% of the history at that point. Before going on, it’s worth thinking how often you would expect rates to have been in the 5% tails. A neutral guess would be 5% in each, so 10% overall.
The data tells a different story though. On this basis, rates would have been “extreme” roughly 30% of the time. Rates have also been in a 10th percentile tail roughly half the time. That means there’s about a 1 in 3 chance that the current environment looks like a 5th percentile extreme case (to check this was not just a result of the early years, we also tested the results since 1950, with similar results). In other words, it is rare that the rate environment has seemed typical. It always seems like the present is special, even when it isn’t.

We also examined moves within these tails, to test for symmetry. Of 234 months where rates seemed extremely low (i.e. they were below the 5th percentile up to that point), they were lower 12 months later 61% of the time. Similarly, in the 222 months when they were extremely high (i.e. above the 95th percentile up to that point), they moved up over the next twelve months 64% of the time. If anything, when rates seem low that has suggested they’ll go lower, rather than higher (which is consistent with momentum investing).
As a final thought, we can also consider it economically, rather than mathematically. Rates are just prices, driven by supply and demand. The PPF index suggests there are about £1.7 trillion of pension liabilities, while the KPMG LDI survey suggests around £0.9 trillion of liabilities are hedged. For context there is about £1.8 trillion of government debt (which has other buyers), so this is not a trivial amount. This is an extremely rough approach, but it shows that there are significant natural buyers of bonds who are not fully invested. There is certainly scope for rates to go lower.
In conclusion, rates are low. They look extremely low. But rates look extreme all the time- it’s very rare they look normal. It doesn’t mean they’re going up any time soon.
|

