|
|


 A key challenge faced by capital modellers is how to appropriately connect changes in premium and reserve volume with the volatility parameters used in capital models. On a theoretical level, we know that volatility typically decreases as volume increases. Despite this, we regularly see modelling processes where the business volumes evolve and the parameters don’t. This article explores why volume and volatility aren’t well joined up and suggests a research-driven formula for quickly adjusting your volatility parameters as volumes change. |
By Adam Smylie, Associate Consultant, Neil Gedalla, Principal and Ed Harrison, Partner from LCP Why are volume and volatility often not joined up? There are a number of reasons why it is surprisingly difficult to create a strong link between volume and volatility. Tight timescales: Modelling timescales are often very tight, so parameterisation is often done well in advance of the period to be modelled. This means that the modelled volumes of business may be very different to those in the historical data used to parameterise volatility. Parameter roll-forward: Volatility parameters (usually coefficients of variation, or “CoVs”), are often reviewed on eg a 3 year cycle. In the interim, CoVs tend to remain unchanged, even if the new business volumes or reserve volumes change. A full re-parameterisation of a risk area requires fresh data, judgement and validation. Lack of validation challenge: Common validation tests used to assess volatility assumptions include benchmarking CoVs against the market and back-testing against the historically observed volatility of the portfolio. These tests do not automatically allow for differences in volume and can potentially give false comfort if changes in volume are not factored in.
Common examples of mismatched volume & volatility
Reserve risk Reserve risk CoVs are often set in Q1 based on the previous year-end reserving data, so the volatility is assessed based on past reserve volumes. Typically these volatility parameters are then applied to expected reserve volumes at the forthcoming year-end, which are forecast based on Q2 projections. If there is a big difference in reserve volumes between the two successive year-ends, the CoVs set may no longer be appropriate if they are not volume-adjusted.
New classes of business
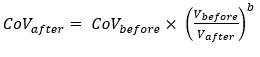
Again, this may cause a volume/volatility mismatch because the established class being used as a benchmark usually has a significantly greater volume than the new business line. Challenges around model parameterisation timescales, resource and prioritisation are unlikely to go away. Given this, can we adjust volatility for volume without doing a full re-parameterisation? Having a simple data-driven formula that links volume and volatility would allow capital modellers to build dynamic volume-driven adjustment of CoVs into the capital process. This could include adjustments: To reflect differences in volume between past data used to set the CoV, and forward-looking business volumes the CoV is applied to. To keep the parameter in line with volumes of business written or reserves held in years when the CoV would otherwise not be updated. What might such a formula look like? A simple example might be expressed as follows:
where V represents volume of business. A key judgement is the fine-tuning of the b parameter. A higher parameter implies the CoV is more sensitive to volume change.
How well does this work in practice? We performed two different types of analysis on the Schedule P dataset of the US National Association of Insurance Commissions (NAIC) return.
Dataset: The NAIC Schedule P dataset contains historical reserving triangles for all US insurers over the period 2011 - 2022, with total reserves of $937 bn. Validation: We cross-checked our results against other data sources and regions. For example, we observed a similar relationship in our annual LCP capital benchmarking survey when comparing participants’ selected CoVs against their reserve volumes. In summary, our research suggested that the power relationship in the formula fits the data really well and that a value for b of around 0.22 is broadly applicable across a range of different datasets. As expected, we also found that b varied by class of business, for example, we found that it tended to be lower for classes more exposed to systemic risks. Next steps We think that adopting a scaling approach that links CoVs to volume addresses a current weakness of many firms’ modelling processes in a simple and efficient way. Overall, firms who create the strongest link between the capital modelling and the risks that business face will be best placed to understand those risks and manage them in line with the overall strategy.
A more comprehensive summary of our research was presented at the IFoA General Insurance Spring Conference and is available to watch on-demand. |
|
|
|
| Actuary - Financial Planning & Analysis | ||
| London/Hybrid - Negotiable | ||
| Reinsurance Pricing Actuary | ||
| London - £140,000 Per Annum | ||
| Head of Capital | ||
| London - £170,000 Per Annum | ||
| ART Pricing | ||
| London - £100,000 Per Annum | ||
| Pricing Transformation Actuary | ||
| London - £130,000 Per Annum | ||
| Pricing Actuary | ||
| London - £80,000 to £120,000 Per Annum | ||
| Pensions on Divorce Startup - Flexibl... | ||
| Remote - Negotiable | ||
| SVP, Head of Reserve Forecast Analytics | ||
| Bermuda - £200,000 Per Annum | ||
| START-UP, Lead Reinsurance Actuary | ||
| London - Negotiable | ||
| Senior Actuary | ||
| London - Negotiable | ||
| Reserving Manager | ||
| London - £130,000 Per Annum | ||
| Senior Reserving Consultant | ||
| London - £100,000 Per Annum | ||
| Head of Capital | ||
| London - £180,000 Per Annum | ||
| Head of Portfolio Optimisation | ||
| London - Negotiable | ||
| Pricing Lead/Manager | ||
| London - £130,000 Per Annum | ||
| Actuary | ||
| London/Hybrid - Negotiable | ||
| Capital Actuary | ||
| London - £110,000 Per Annum | ||
| Senior Reserving Actuary | ||
| London - Negotiable | ||
| Head of Capital | ||
| London/Hybrid - Negotiable | ||
| Head of Pricing | ||
| London - £170,000 Per Annum | ||


Be the first to contribute to our definitive actuarial reference forum. Built by actuaries for actuaries.
Copyright © 2026 Actuarial Post. Created by Zero-One Design Ltd