|
|


 Schroders, examines how concern is growing that an energy shock triggered by the Iran war will lead to a period of stagflation - something that may make investors wary. But history suggests stocks in an environment of low growth and high inflation may not perform as poorly as investors fear. On the back of soaring energy prices, fears are once again rising that the global economy could be heading in a stagflationary direction – one where economic growth is weak and inflation high. |
By Duncan Lamont, Head of Strategic Research, Schroders On average, this is the worst kind of environment for the stock market. But investors need not panic. Our analysis shows that stocks often perform well when there is stagflation, just not as well as at other times. Importantly, there has been divergence in sector performance in these environments and performance between companies is likely to rise, too. There is an argument that the sector allocation of European stock markets could benefit them relative to the US. This would be problematic for many investors, given that the US dominates the global market. As well as the well-trodden valuation argument, this is one more reason why we believe investors should be wary of passive approaches to investing in global equities today. Why does stagflation present a challenge for companies and investors?
Low growth is bad for sales, as businesses and consumers tighten their belts. Demand is weak and high inflation adds to the headache. In a buoyant economy, companies can pass on higher input costs to consumers. When demand is already weak, this is not so easy. Corporate profit margins often take a hit instead, putting additional downward pressure on earnings.
As well as weakening corporate fundamentals, the ability of central banks to stimulate demand by cutting interest rates is also hampered. When inflation is high, they typically want higher interest rates to bring inflation under control, not lower. And higher rates risk making the “stagnation” worse. But if they were to cut rates, then that risks sending inflation even higher. There are no easy options. How do stocks perform during stagflation?
In this analysis, we have defined stagflation fairly simplistically: real gross domestic product (GDP) growth below the previous 10-year average and Consumer Price Index (CPI) inflation above its 10-year average. By keeping things simple, we can analyse market performance over the past nearly 100 years. When it comes to analysing sectoral performance, this covers the period since 1974.
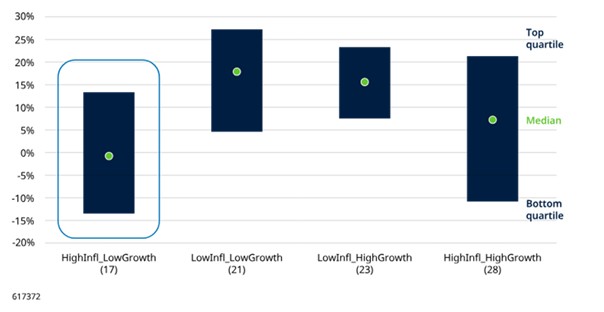
We compare using 10-year averages rather than fixed rates of growth and inflation because what will have felt like low growth or high inflation to investors isn’t constant over time. It depends on what they will have been used to. This is a less severe definition of stagflation than those that require there to have been a recession (negative growth). As could be anticipated for the environment described above, stocks often find the going tougher during stagflation-years compared with other environments. Based on data since 1926, the median yearly real return in a stagflation-year has been about 0%. This is less than investors would typically want from equities over the long-run, but getting close to inflation in a high inflation environment is not a bad outcome. In addition, in about half of these years, they generated a positive real return. And, when these real returns have been positive, they have tended to be strong, averaging about 16%. In the interests of balance, it is worth pointing out that when they were negative, they averaged –14%. Figure 1: Equities perform well in around half of stagflationary environments, worse than others but should not be ruled out US real equity returns when inflation and growth are above/below their 10-year average, 1926-2025 calendar year data (number of occurrences in brackets).
Past performance is not a guide to future performance and may not be repeated.
Half of all outcomes fell inside the blue shaded area, with a quarter above it and a quarter below. HighInfl = inflation above the previous 10yr average, HighGrowth = real GDP above the 10yr average, and vice-versa for LowInfl and LowGrowth. Based on analysis of data on US equities 1926-2025. Because the first 10yrs are used to calculate the first 10yr averages, this leads to 90 years where an assessment of the economic status is made. Equities represented by Ibbotson® SBBI® US Large-Cap Stocks to 2024, S&P 500 thereafter, cash by Ibbotson® SBBI® US (30-Day) Treasury Bills to 2024, US Treasury constant maturity 1-month rate thereafter. Data to December 2025. Source: Morningstar Direct, accessed via CFA institute, LSEG Datastream, S&P, and Schroders.
When assessed relative to cash, equities come out better, outperforming cash more often than not (in 10 of the 17 stagflation-years). This may be a riskier than normal time for stocks, but it can also be a risky time to sit in cash. Furthermore, statistical analysis of how stocks have performed relative to cash in stagflation-years compared with the rest of the time indicates there is no significant (in a statistical sense) difference. In other words, any difference could be due to random noise rather than a meaningful relationship. There does not need to be an earlier crash or rate cuts for stocks to perform well
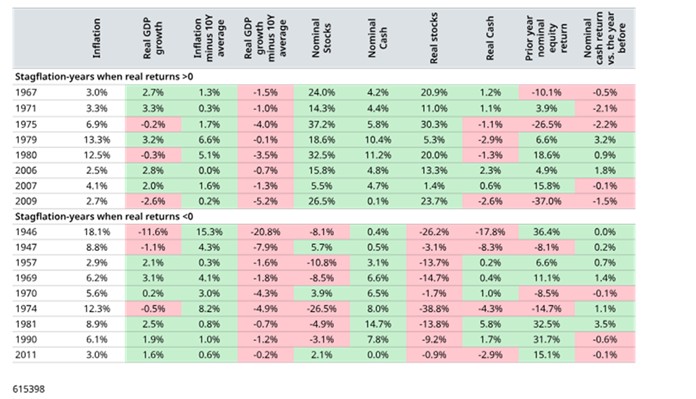
It is worth asking if there are economic and market conditions that have been necessary to support equities in these more favourable outcomes, to aid investment decision-making today. The number of stagflation-years when a positive real return was generated was small, at only eight (1967, 1971, 1975, 1979, 1980, 2006, 2007, 2009), so we need to be highly wary of making bold claims. But that is not the aim here. The data shows that, even in this small sample, there have been a diverse range of backdrops (Figure 2) that still allow for some conclusions to be drawn:
It is not necessary for the market to have fallen the year before i.e., the good performance being a rebound. In most cases, it followed a year when real returns were positive (second last column in Figure 2) It is not necessary for interest rates to be cut. We assess this by comparing cash returns with the year before (a lower figure implying rates were cut). In 1979, 1980, 2006 they were raised, and in 2007 they were broadly flat (final column in Figure 2). Figure 2: Positive (and negative) real returns during stagflation are not conditional on prior year market performance or rate cuts Calendar years when inflation was above, and growth below, their 10-year averages, 1926-2025.
Past performance is not a guide to the future and may not be repeated.
Figures are shown on a rounded basis. Calendar years shown are those where both real GDP growth was below the previous 10-year average and CPI inflation was above its 10-year average. Based on analysis of data on US equities 1926-2025. Because the first 10 years are used to calculate the first 10-year averages, this leads to 90 years when an assessment of the economic status is made. Equities represented by Ibbotson® SBBI® US Large-Cap Stocks to 2024, S&P 500 thereafter, cash by Ibbotson® SBBI® US (30-Day) Treasury Bills to 2024, US Treasury constant maturity 1-month rate thereafter. Data to December 2025. Source: Morningstar Direct, accessed via CFA institute, LSEG Datastream, S&P, and Schroders.
There is no historical reason why investors should expect stocks to fall, even if we do enter stagflation. There can be lower conviction of strong returns but predicting doom is not appropriate either. Do some parts of the market perform better than others during stagflation?
Sectoral data is only available since 1974, and that reduces the number of stagflation-years we can analyse. In addition, sectors themselves have changed a lot over time. Communications services used to be telecom companies, such as AT&T, whereas today Alphabet (Google) and Meta combined make up nearly three quarters of the sector on a market capitalisation basis (as at 28 February 2026). Conclusions from historical analysis must therefore come with lower conviction, and be overlaid with qualitative judgement.
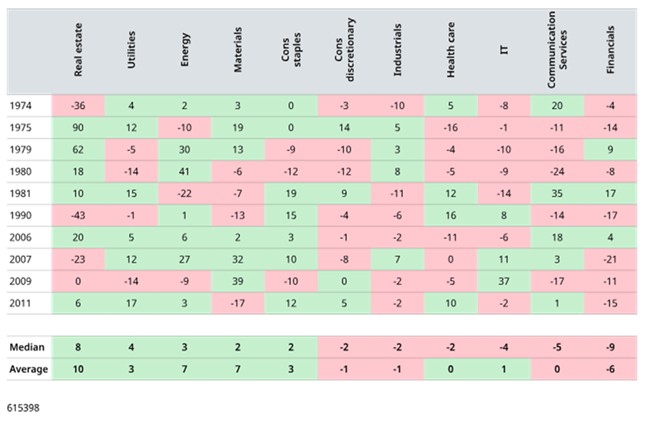
Figure 3: Sectoral performance is mixed during stagflation US sectoral real equity returns when inflation is above and growth below its 10-year average, 1974-2025, calendar year data.
Figures are shown on a rounded basis. Based on analysis of data on sectors of the US equity market 1974-2024. Calendar years shown are those where both real GDP growth was below the previous 10-year average and CPI inflation was above its 10-year average. Based on Datastream US sector indices. Source: LSEG Datastream and Schroders. Past performance is not a guide to the future and may not be repeated. While acknowledging the caveats above, many of these divergences are intuitive:
Defensive sectors such as utilities and consumer staples perform relatively well, as demand is less sensitive to the economic cycle.
Energy and materials companies have typically performed well because high commodity prices have often been a cause of the high inflation during stagflation, as is the risk at present.
Health care would also typically be classified as a defensive sector (its performance is less variable than that of the overall market, on average), so it is interesting that its performance has underwhelmed when growth has been low and inflation high over the 1974-2025 period. It is possible to anlayse this sector over a longer history (back to 1927) using an alternative source – the data library produced by highly regarded academic, Kenneth French. This is not possible for all other sectors on a consistent basis. When we do this, the healthcare sector’s performance ties in more with intuition. It performed well in the 1940s, 50s, 60s, 70s, 80s and 90s episodes of stagflation but less well in the 2000s. Its median outperformance in a stagflation-year over this longer period has been 4%. This allows us to take a more positive view on the sector’s performance during stagflation than the table above would suggest. A comparison of results under the two data sets is provided at the end of this article.
So-called “real assets” such as real estate can do relatively well but this sector also has one of the widest ranges of outcomes. When it comes to individual investments, performance depends on the sector of the real estate market, the length of and any inflation linkage in the rental agreement, debt maturity profile, and other factors. Real estate investors have to understand the operational risk of their tenants if we enter stagflation.
Consumer discretionary usually underperforms consumer staples, as individuals cut back on non-essentials.
IT and communication services also both have a poor track record. This is due to a combination of demand weakness alongside rising supply costs, but also valuation impacts. IT companies, especially growth-oriented ones, tend to have high price-to-earnings (P/E) ratios because investors expect strong future earnings. The higher interest rates that usually accompany stagflation reduce the present value of future earnings, hitting growth stocks like IT companies particularly hard. This is also relevant for today’s crop of communication services companies. One potential difference for today’s big growth companies is that many are highly profitable and have global scale. Although they have increased borrowing significantly to finance capex, most also have strong balance sheets e.g., interest cover is higher than the average investment grade bond issuer.
Financials have performed poorly. Often during stagflation, yields curves invert (flip from their usual upward-sloping shape where longer dated yields are higher than shorter dated ones, to a downward-sloping one where the opposite is true). This happens as central banks keep short term rates high to manage inflation while the market prices these to fall over time. “Safe haven” buying of government bonds can also be a factor pushing longer-dated yields lower. Inverted yield curves hurt banking profitability as the short-term interest rates that banks have to pay out on deposits rise above the longer-term rates they earn as income on loans. Banks may also have to shoulder rising defaults from borrowers and weak loan demand. A difference today is that yield curves have been steepening recently, as the market digests higher future inflation and expectations for increased government bond issuance in the coming years. This helped financials to perform well in 2025. Expectations for banking sector deregulation could also support profitability. So far so good, but serious growth concerns could easily lead to tumbling longer-term yields, putting this performance at risk.
While many of these are intuitive, it is important to again highlight the small sample size. When we run statistical tests (see Appendix), the only sectors where performance comes out as significantly different during stagflation-years are the materials and financial sectors. Do any global stock markets have more, or less, favourable sector allocations?
When assessing this, it is important to complement historical analysis with qualitative judgement based on the current economic and market environment.
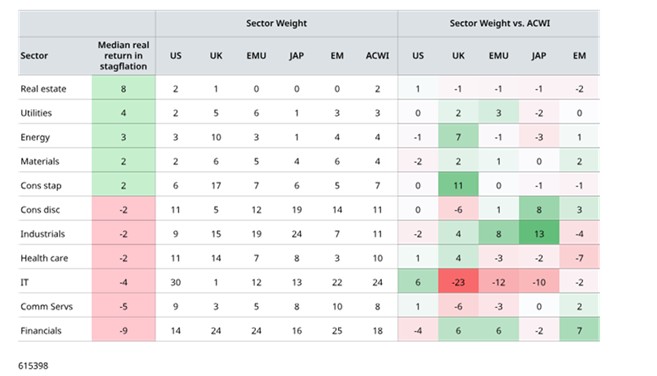
Figure 4: Regional market composition
Past performance is not a guide to the future and may not be repeated.
Figures are shown on a rounded basis. Stagflation defined as both real GDP growth below the previous 10-year average and CPI inflation above its 10-year average. Median real returns are as set out in Figure 4. US = MSCI USA index, UK = MSCI UK index, EMU = MSCI EMU Index, JAP = MSCI Japan index, MSCI ACWI = MSCI All Country World Index. Sector weights as at 28 February 2026. Source: LSEG Datastream and Schroders.
The US stands out for its large allocation to the IT sector, which has historically struggled during stagflation. Its communication services behemoths, Alphabet and Meta, are also technology companies in all but sector classification. In contrast, the US allocations to the sectors that have performed better during stagflation are all relatively low in absolute terms (totalling 15%). The US does not look like a candidate for strong performance if stagflation becomes a reality. On the one hand, the European market would appear to suffer from its large allocation to the industrials sector. Europe has also been very publicly in the firing line for President Trump's tariffs. However, Germany’s plans to increase borrowing to boost defence and infrastructure spending should support many European industrials, especially given the bias towards “buying European” rather than from the US. Overweights to the utilities sector and underweights to IT and communication services could also be beneficial. In principle, the financials overweight is more problematic but, as it stands today, financials are in reasonable shape and benefitting from a steeper yield curve. This will be a sector to keep an eye on. The UK, a market which has been unloved by global investors for many years, is also an intriguing proposition. Its 16% allocation to the defensive consumer staples sector and 10% to energy are more than double any other major market has to either. Plus, it has barely any exposure to the IT or communication services sectors compared with elsewhere. Like Europe, the UK is overweight financials. While not without risk, there is definite potential for negative perceptions about the UK market’s boring, defensive, nature to turn to its advantage. It also remains cheaply valued compared with overseas markets and therefore has a more favourable starting point. Japan is weighed down by large allocations to global industrials, which are sensitive to international trade, and consumer discretionary. These sectors make up 44% of the MSCI Japan Index. It also does not have an overweight allocation to any of the sectors that one would anticipate could perform better. There are positive developments in corporate governance in Japan (moves to more shareholder friendly approaches) and valuations are relatively cheap, but the global backdrop is challenging. Sector allocations are also not particularly favourable for emerging market equities, with overweights in consumer discretionary, communication services and financials. Whichever market you look in, there will be winners and losers. Sector allocations can provide useful insights into potential risks but it is only by analysing individual company fundamentals that investors can hope to identify those which have the potential to thrive and those which risk underperforming. What does this mean for today?
Stagflation risk is on the rise. Much is written about stagflation, with the potential to cause equity investors to panic. In this article we set out why we think this may be overblown. We can draw four conclusions:
Stocks perform worse during stagflation than at other times, but the difference is not statistically significant. Historically, they have outperformed cash and kept pace with inflation. There can be lower conviction of strong returns but predicting doom is not appropriate either. There is always a reason to worry and long-term investors are likely to benefit from staying invested. Good performance in stagflation is not dependent on the market having fallen beforehand i.e., a rebound. Nor are rate cuts a necessary ingredient. This should provide some comfort to equity investors today. Performance during stagflation varies a lot between sectors, and across historical episodes. Although, statistically, there is insufficient data to draw firm conclusions, we can add to that with qualitative judgement and intuition. On this basis, the US and Japanese markets look negatively exposed to stagflation risk. Europe and the UK are more interesting propositions. Investors passively tracking the global market could find this uncomfortable, given the MSCI World Index has 70% in the US and MSCI ACWI has 62%. Stagflation could encourage the broadening out trend seen so over 2025 and early 2026 to continue. While we have not analysed individual company financials within this article, it should be obvious that there will be increased variation in performance at the company-level should we enter stagflation. Balance sheet resilience and pricing power will be important. As correlations among stocks fall and dispersion in returns rise, the potential for active managers to add significant value should rise with it. |
|
|
|
| Actuary - Financial Planning & Analysis | ||
| London/Hybrid - Negotiable | ||
| Reinsurance Pricing Actuary | ||
| London - £140,000 Per Annum | ||
| Head of Capital | ||
| London - £170,000 Per Annum | ||
| ART Pricing | ||
| London - £100,000 Per Annum | ||
| Pricing Transformation Actuary | ||
| London - £130,000 Per Annum | ||
| Pricing Actuary | ||
| London - £80,000 to £120,000 Per Annum | ||
| Pensions on Divorce Startup - Flexibl... | ||
| Remote - Negotiable | ||
| SVP, Head of Reserve Forecast Analytics | ||
| Bermuda - £200,000 Per Annum | ||
| START-UP, Lead Reinsurance Actuary | ||
| London - Negotiable | ||
| Senior Actuary | ||
| London - Negotiable | ||
| Reserving Manager | ||
| London - £130,000 Per Annum | ||
| Senior Reserving Consultant | ||
| London - £100,000 Per Annum | ||
| Head of Capital | ||
| London - £180,000 Per Annum | ||
| Head of Portfolio Optimisation | ||
| London - Negotiable | ||
| Pricing Lead/Manager | ||
| London - £130,000 Per Annum | ||
| Actuary | ||
| London/Hybrid - Negotiable | ||
| Capital Actuary | ||
| London - £110,000 Per Annum | ||
| Senior Reserving Actuary | ||
| London - Negotiable | ||
| Head of Capital | ||
| London/Hybrid - Negotiable | ||
| Head of Pricing | ||
| London - £170,000 Per Annum | ||


Be the first to contribute to our definitive actuarial reference forum. Built by actuaries for actuaries.
Copyright © 2026 Actuarial Post. Created by Zero-One Design Ltd