|
|


 Insurance companies are experts at using historical data to form views on possible future outcomes. These views are then used in a variety of ways from setting assumptions for calculating technical provisions and calibrating internal models, to assessing risk exposures and designing and evaluating hedging strategies. But what if there was a way to peer into the future rather than just the past? Option prices in financial markets can provide exactly that: forward-looking insights into probability distributions for financial risks. |
By Amit Lad, Principal, Insurance and Longevity Consulting, Barnett Waddingham This article explores how insurers can leverage the insights embedded in option prices to help validate their forward-looking risk estimates and obtain real-time indicators of potential changes in risk outlooks.
The limitations of the rear-view mirror Option prices can offer a complementary perspective by revealing how market participants are currently pricing forward-looking risks. This provides a ‘point-in-time’ (PIT) perspective that is at odds with the typical ‘through-the-cycle’ (TTC) interpretation of internal model calibrations. Nonetheless, by monitoring changes in the PIT view, and its divergence from the TTC view, it can provide useful insights for supporting calibrations, and supporting risk management more generally.
A simple example: 99.5% one-year VaR on the FTSE100 Using this as our best estimate of one-year FTSE100 index volatility and assuming a lognormal distribution with an equity risk premium of 4%, we can calculate that the 99.5th percentile one-year change in the equity index would be a fall of c27%1. This quick calculation gives us a starting point, but it relies on a significant assumption: that equity returns follow a lognormal distribution and have constant volatility as assumed in the Black-Scholes model.
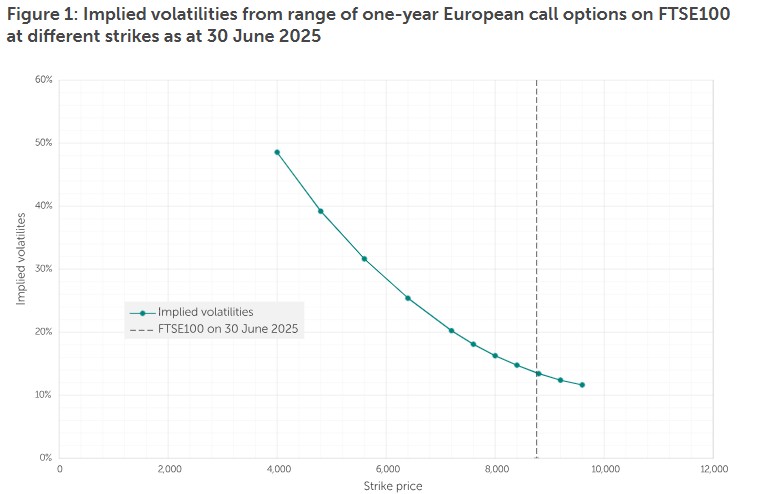
Enriching our view: the volatility smile For example, the chart below shows the implied volatilities of a range of one-year FTSE 100 call options with a range of different strike prices.
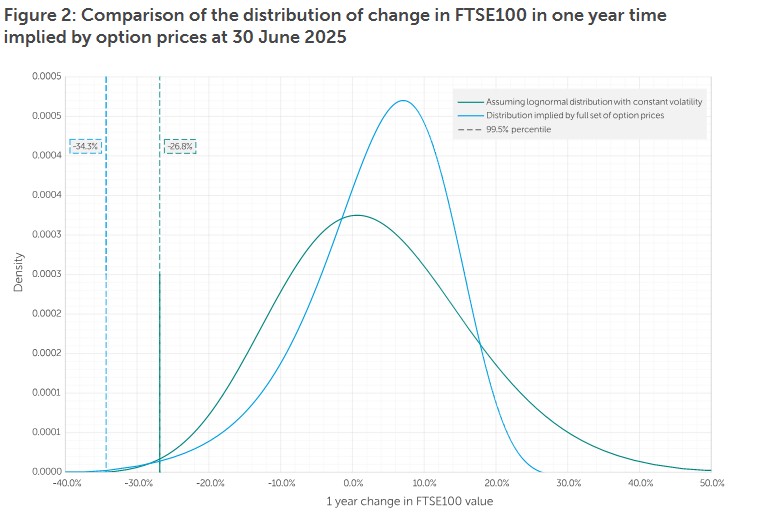
This volatility smile suggests that the market does not believe the FTSE100’s one-year probability distribution is a lognormal distribution as per our introductory example. For the FTSE100, options with lower strike prices (in-the-money call or out-the-money puts) have higher implied volatilities than at-the-money options. This pattern implies the market attaches higher probabilities to significant downside moves. The 99.5th percentile index fall implied by these prices will be greater than the c27% implied by assuming a lognormal distribution with a constant volatility assumption equal to the at-the-money option’s implied volatility. Mathematical techniques have been developed to derive the probability distribution implied by volatility smiles such as the one above, and we develop an example below. By fitting an exponential curve to the volatility smile, and applying the Breeden and Litzenberger (1978) result2, we obtain a risk-neutral probability distribution for the change in FTSE100 value that is implied by the collection of FTSE 100 option prices. We can then apply a utility function to the risk-neutral probability distribution calibrated to produce an equity risk premium of 4% to capture risk aversion. This has the effect of transforming the risk-neutral probability distribution into a real-world probability distribution. Below we show two probability distributions – a lognormal distribution that only considers one option price (the at-the-money option); and the distribution that is implied by the whole set of option prices.
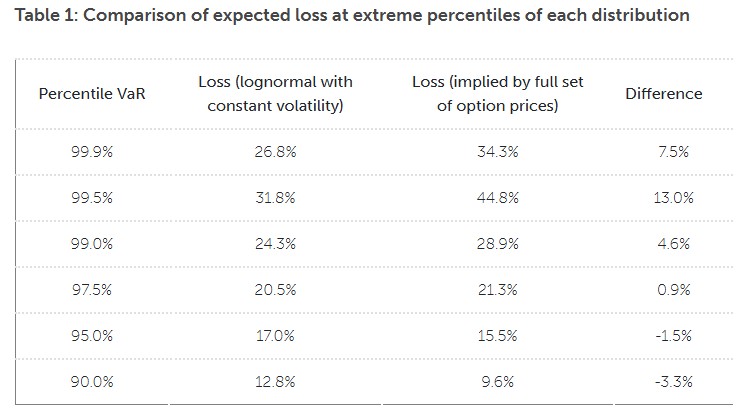
Allowing for the volatility smile and the higher implied volatilities at lower strike prices gives the resulting distribution a fatter left tail than a lognormal distribution. The next table tabulates the impact at key extreme percentiles.
We note that the loss implied by the full set of option prices is consistent with the c43.3% 99.5th percentile loss assumed in the Standard Formula Type 1 equity capital calculation as at 30 June 2025.
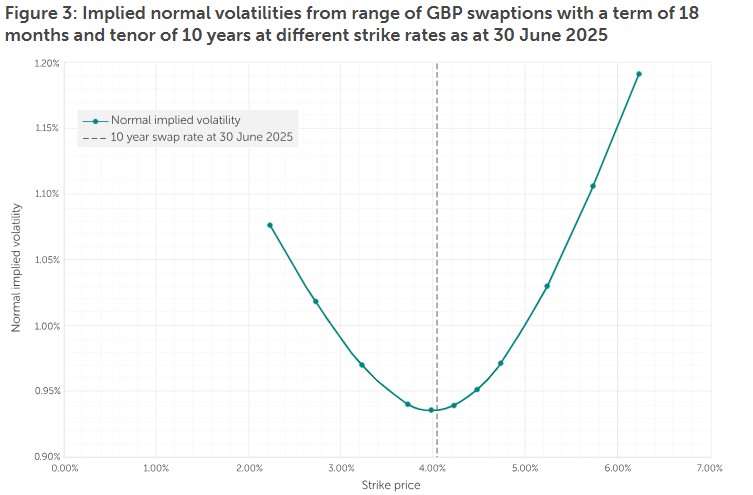
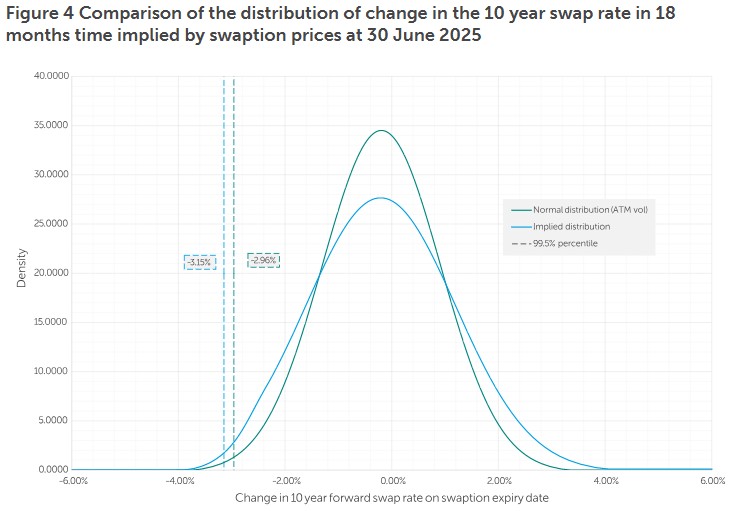
Application to interest rates The volatility smile looks very different to what we observed for the FTSE100 above.
In this example, we have fitted a clamped cubic spline to these volatilities, instead of the exponential function used in the FTSE100 example. Furthermore, we have assumed the interest rate risk premium is zero, and so there is no difference between the real-world and risk-neutral probability distributions in this example. Below we show two probability distributions – a normal distribution that only considers one option price (the at-the-money option); and the distribution that is implied by the whole set of option prices.
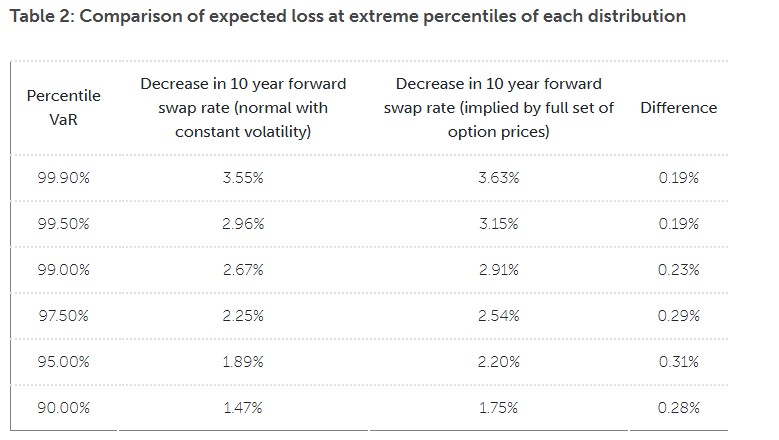
As in the FTSE 100 example, allowing for the volatility smile enriches the resulting option-implied distribution. In this example both tails are fatter than the normal distribution. The next table tabulates the impact at key extreme percentiles.
Conclusions and acknowledging the limitations It might be argued that option-implied volatilities are upwardly-biased by the absence of allowance for these factors in option pricing models. To make some allowance for this, option-implied volatilities could be scaled down before using them as inputs for deriving implied distributions. Nonetheless, we consider that option pricing dynamics, and how they evolve over time, can provide useful forward-looking insights for risk managers. For example, while in the first example above, the implied volatility from a one-year ATM FTSE 100 call option as at 30 June 2025 was c14%, in the last decade it has ranged from c9% to c30%! In an actuarial risk world that is often focused on decades-old data, changes in option prices can act as one of the ‘canaries in the coalmine’ that risk managers can reference to understand real-time changes in the risk environment.
Endnotes 2 Breeden and Litzenberger (1978), “Prices of State Contingent Claims Implicit in Option Prices”, Journal of Business, 51, pp621-651. |
|
|
|
| Actuary - Financial Planning & Analysis | ||
| London/Hybrid - Negotiable | ||
| Reinsurance Pricing Actuary | ||
| London - £140,000 Per Annum | ||
| Head of Capital | ||
| London - £170,000 Per Annum | ||
| ART Pricing | ||
| London - £100,000 Per Annum | ||
| Pricing Transformation Actuary | ||
| London - £130,000 Per Annum | ||
| Pricing Actuary | ||
| London - £80,000 to £120,000 Per Annum | ||
| Pensions on Divorce Startup - Flexibl... | ||
| Remote - Negotiable | ||
| SVP, Head of Reserve Forecast Analytics | ||
| Bermuda - £200,000 Per Annum | ||
| START-UP, Lead Reinsurance Actuary | ||
| London - Negotiable | ||
| Senior Actuary | ||
| London - Negotiable | ||
| Reserving Manager | ||
| London - £130,000 Per Annum | ||
| Senior Reserving Consultant | ||
| London - £100,000 Per Annum | ||
| Head of Capital | ||
| London - £180,000 Per Annum | ||
| Head of Portfolio Optimisation | ||
| London - Negotiable | ||
| Pricing Lead/Manager | ||
| London - £130,000 Per Annum | ||
| Actuary | ||
| London/Hybrid - Negotiable | ||
| Capital Actuary | ||
| London - £110,000 Per Annum | ||
| Senior Reserving Actuary | ||
| London - Negotiable | ||
| Head of Capital | ||
| London/Hybrid - Negotiable | ||
| Head of Pricing | ||
| London - £170,000 Per Annum | ||


Be the first to contribute to our definitive actuarial reference forum. Built by actuaries for actuaries.
Copyright © 2026 Actuarial Post. Created by Zero-One Design Ltd