By Alex White, Head of ALM Research at Redington
You need more data to be confident about the 99th percentile than you do about the mean. I’ve touched on some of these issues before(1) ; this article is a different lens on a similar problem. We know there’s a problem here, but can we say anything sensible about how large it is?
To model tails, we use S&P daily data since 1928 – this is price data, but for properties such as volatility and kurtosis, it’s very similar to total return data. The kurtosis of daily (log) moves is 20; for monthly moves, it’s seven, and for annual moves, it’s one (notwithstanding the margins of error arising from which month is used as the base month for each year). This is a huge variation, implying the problem of equity tails is enormous with daily data and not that big a problem with annual data.
We must be careful here – the further into the tail you go, the more likely there’s an extreme tail risk event that just hasn’t happened to occur yet, and therefore doesn’t appear in the data. But the conclusion does make sense. Information arrives in somewhat discrete chunks, and a lot of this gets smoothed out over a year.
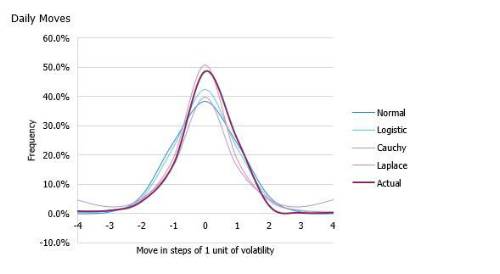
As another lens, we can look at which distribution best fits the data. To keep it simple, we compare four related distributions with different levels of kurtosis (technically, we also pick them with comparable parameterisation describing the log returns, so that log-likelihoods are comparable and we can run tests like the Akaike information criterion, or ‘AIC’). We pick the normal distribution, the logistic (kurtosis 1.2), the Laplace distribution (kurtosis 3), and the Cauchy distribution, a distribution so fat-tailed that the mean isn’t even defined.
Now the numerical differences aren’t obviously comparable between daily and annual tests, as the daily data set is effectively 260 times larger. However, the results are striking. For daily moves, the AIC test overwhelmingly favours any of the other distributions over the normal, with the Laplace best and the wildly extreme Cauchy distribution second best. This can somewhat be seen in the graphs below – daily data is extreme.
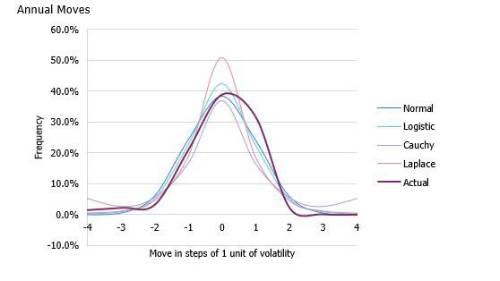
However, for the annual data, the slightly fat-tailed logistic distribution fares best, only slightly better than the normal. The Laplace scores negligibly worse than the normal distribution, and the Cauchy dramatically worse.
So fat tails are unquestionably there in equities – it’s just that they’re a much, much smaller problem when considering annual moves.
(1). https://www.actuarialpost.co.uk/article/how-fat-is-a-fat-tail-13688.htm
|